
System Interrupts high CPU usually points to work in a hardware or driver path. The Task Manager entry accounts for interrupt handling; it is not an app you can uninstall or a process you should try to end. If the number flashes up and settles, observe it before changing anything. If it stays high while Windows stutters, save your work, restart, then test nonessential peripherals one at a time. The useful result is a repeatable change in CPU load that narrows the responsible device or driver.
This guide focuses on Windows 11 PCs. Most checks also apply to Windows 10, although Settings and diagnostic-tool screens can differ. A high number alone does not identify malware or mean the processor needs replacing.
First, confirm which CPU number is high
Press Ctrl + Shift + Esc, open Processes, and sort by CPU. Record the percentage beside System Interrupts, not just the total CPU figure at the top. Also note what is happening: idle desktop, a game, audio playback, a download, docking, or waking from sleep.
- A brief spike that settles: watch for recurrence and a matching symptom. Do not disable devices just to make every CPU sample read zero.
- Sustained activity with stuttering, audio crackle, or missed input: use the isolation steps below. Compare the same workload each time.
- Another row is doing the work: follow that process. For example, TiWorker.exe high CPU calls for an update-servicing check. dasHost.exe activity concerns device association and is a different troubleshooting path.
There is no single percentage that diagnoses every PC. A sustained change from your usual behavior, together with a reproducible symptom, is more useful than a one-frame screenshot.
What Windows means by System Interrupts
Hardware can request the processor’s attention through an interrupt. Windows runs an interrupt service routine (ISR); work that can be deferred may run as a deferred procedure call (DPC). These routines can take time away from ordinary application threads, so excessive interrupt work can affect audio, video, and responsiveness. Microsoft documents this distinction in its CPU analysis guide. [1]
Think of the Task Manager entry as a busy reception desk: it shows time spent handling requests, but does not name the device making them. Replacing the receptionist would not explain why the phone keeps ringing. Likewise, closing applications may make a comparison easier, but it does not identify the interrupt source.
Isolate a peripheral with a before-and-after test
Start with the most reversible change. Keep your keyboard, mouse, display, and anything needed to operate the PC connected. Finish transfers and safely eject external storage before disconnecting it.
- Establish a baseline. After a restart, reproduce the problem and watch it for about a minute. Write down the symptom, connected devices, and approximate System Interrupts range. This is a comparison interval, not a pass/fail threshold.
- Disconnect one nonessential device. Start with a recently added webcam, USB audio interface, controller, hub, or dock. For a dock, arrange working power and display connections first.
- Repeat the same activity. If CPU use and the symptom improve, you have narrowed a device path. If nothing changes, reconnect that device before testing the next one.
- Confirm the pattern. When safe, reconnect the suspected device and repeat once. A problem that returns with that connection is stronger evidence than a one-off improvement.
- Separate the device from its connection. Try a known-good cable or a direct port instead of the hub, changing only one thing at a time. Then check the device or PC manufacturer’s driver and firmware guidance.
Example: a USB headset is connected when the sound crackles and interrupt activity rises. Both settle when it is unplugged and return after reconnection. That points investigation toward the headset, cable, port, hub, or audio driver; it does not yet prove the headset hardware is defective. Test the direct connection before buying a replacement.
Do not blindly disable USB Root Hubs, storage controllers, system devices, or every network adapter in Device Manager. You can lose input, storage access, or the remote connection you need to recover. If testing an internal device requires disabling it, use a clearly identified nonessential device, a local session, and a known way to re-enable it. Otherwise, move to trace collection or vendor support.
Compare driver changes before changing more settings
If the issue began after a driver update, record the device name, driver provider, version, and date from Device Manager → device Properties → Driver. The timing is a lead to test. It is not enough by itself to blame the newest driver.
Use Windows Update or the device/PC manufacturer’s official support page for your exact model. If the problem followed a specific update and Roll Back Driver is available, a rollback can provide a useful comparison. Microsoft describes the update, reinstall, and rollback controls in Device Manager. [2] Keep the previous version details so you can explain the result to support.
After a change, restart when required and repeat the original workload. Record whether both the CPU behavior and the visible problem improved. Installing several driver packages at once makes that result harder to interpret.
Avoid third-party bulk driver updaters, loose .sys downloads, and registry “interrupt optimization” scripts. Do not turn off antivirus protection, Memory Integrity, or virtualization security as a generic performance fix. BIOS or firmware changes belong later, when model-specific release notes or support findings connect them to the symptom.
If it happens only after sleep or docking
Compare two states with the same devices connected: immediately after a normal restart, then after sleep and wake. If the issue appears only after resume, record that distinction instead of treating a restart as a permanent fix.
Repeat the one-device test in the failing state. If removing a dock clears the symptom, check the dock model, connection cable, power arrangement, and its supported firmware/driver package. If no peripheral changes it, gather evidence for the PC vendor. Do not copy power-management or BIOS settings from a forum about a different laptop.
Trace persistent DPC/ISR activity with Microsoft’s tools
When simple isolation does not narrow the problem, a short trace can give support more than a Task Manager percentage. Windows Performance Recorder (WPR) and Windows Performance Analyzer (WPA) are available through Microsoft’s Windows Performance Toolkit. Use the Microsoft documentation in the References section to obtain the tools.
- Open WPR with administrator permission. In its recording options, use the General performance scenario and include CPU recording. Keep the default diagnostic profile rather than an unrelated app-only trace.
- Start recording, reproduce a short instance of the slowdown, then stop and save. Note the approximate time the symptom occurred. Do not leave a file-mode recording running indefinitely: trace files can become very large. [3]
- Open the recording in WPA. Find the DPC/ISR graph and its Duration by Module, Function view. Select the time span with the symptom and inspect the modules consuming time. If the graph is absent, the capture does not contain the needed events; do not infer that interrupts were normal.
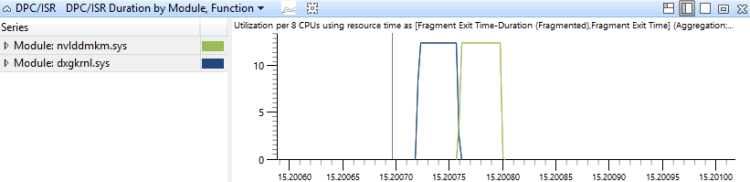
The module is a lead, not an automatic removal target. Shared Windows components such as ntoskrnl.exe, ndis.sys, or dxgkrnl.sys may participate in a longer driver path. Match the activity to the device, symptom timing, recent driver change, and isolation result. Do not delete a Windows component because it appears near the top of the trace.
If the busy Task Manager row is System (PID 4), the ntoskrnl.exe high-CPU guide explains how to inspect its CPU sample stacks and compare a targeted change.
For support, collect the PC model, Windows build, relevant driver versions, exact trigger, and the before/after observations. A technician can use the trace to investigate the path further. Traces can contain process names, paths, and other system details; share them through a trusted support channel rather than uploading them to a public forum by default.
When a malware check belongs in the investigation
The genuine System Interrupts entry is not itself a virus. An actual executable called System Interrupts.exe, however, is a separate file whose identity needs checking. Follow the EXE safety checks for its origin, signature, and launch context.
If the slowdown began after an untrusted installer or “driver updater,” or an antivirus alert identifies a real file, stop using that installer and preserve quarantine. Bundled software or persistence may remain after the visible app is removed. Run a full scan with Gridinsoft Anti-Malware to check for detections and unwanted components, then restart and reassess the symptom. A scan does not repair failing hardware, and a clean result is not a substitute for identifying a reproducible driver problem.
If the process path is wrong, the name imitates a Windows component, or high CPU started after an unknown installer, scan for hidden miners, services, startup entries, and bundled components.
Scan for unwanted componentsStop experimenting and seek hardware support if the PC repeatedly freezes, loses storage devices, or cannot be operated reliably. Back up accessible important files first. The aim is to restore a stable system with a change you can explain—not to collect a long list of disabled devices.
References
- Microsoft. “CPU Analysis.” Microsoft Learn, accessed September 10, 2026. CPU scheduling and DPC/ISR analysis.
- Microsoft. “Update drivers through Device Manager in Windows.” Microsoft Support, accessed September 10, 2026. Device Manager driver controls.
- Microsoft. “WPR How-to Topics.” Microsoft Learn, accessed September 10, 2026. Start and stop a performance recording.