

ntoskrnl.exe high CPU usage means Windows is spending processor time on kernel work, but the filename does not identify what started that work. In Task Manager, first confirm that the busy entry is System, PID 4. Then reproduce the slowdown, check recent device or driver changes, and capture a short CPU trace if the cause remains unclear. Do not delete or replace ntoskrnl.exe, end System, or disable a collection of services to make the number fall.
The useful result is a repeatable explanation: which activity makes System busy, which component appears in that activity, and whether a targeted change fixes both the CPU load and the slowdown. This guide focuses on that decision in Windows 11; the main tools also apply to Windows 10, although their screens may differ.
Make sure you are looking at System, not System Idle Process
Press Ctrl + Shift + Esc, sort Processes by CPU, and open Details to check the process name and PID. These similar labels lead to different investigations:
- System, PID 4: the Windows system process. Kernel threads and driver-related work can consume CPU here. The kernel image is normally
C:\Windows\System32\ntoskrnl.exe; a genuine Windows component can be busy because of work requested elsewhere. - System Idle Process, PID 0: accounts for unused processor time. A large percentage here normally means CPU capacity is available. It is not the busy System process and does not need to be killed.
- System interrupts: accounts for interrupt handling rather than an ordinary app. If this is the high row, follow the System Interrupts driver and device guide.
- Service Host or svchost.exe: hosts Windows services. Use the Service Host: Local System guide to identify the services inside the current PID.
Record the CPU value beside the relevant row, not only the total at the top. A brief burst that settles after startup or an installation is different from sustained load that returns with stuttering. There is no single percentage that diagnoses every PC.
If CPU is modest but storage stays busy, change the investigation. The SysMain disk-usage guide explains disk active time, response time and I/O identification. For growing memory use, the Memory Compression guide covers memory pressure. CPU, disk activity and RAM consumption are not interchangeable symptoms.
1. Find the action that makes System busy
Save your work and finish any pending restart. Compare a short quiet period with the action that usually causes the problem: waking from sleep, connecting a dock, playing audio, launching a game, copying files, or starting a virtual machine. Keep the device connections and power arrangement the same between comparisons.
Write down the Windows build, approximate System CPU range, symptom, time and trigger. If the problem appears only after sleep, compare that state with a normal restart. A restart that clears it temporarily is useful evidence, but it does not explain the resume failure.
For a recently connected nonessential peripheral, repeat the same workload with it disconnected. Finish transfers and safely eject storage first; keep working input, display and power connections. Reconnect it afterward when safe. If the issue returns, try a direct port or known-good cable as a separate comparison. Do not disable storage controllers, USB root hubs or the network connection you need for remote access.
An app can also create kernel work. If opening one optional application reliably starts the load, close it normally and compare. Keep that result with the app version. Avoid turning off antivirus protection, Memory Integrity or unrelated services as a generic experiment.
2. Record a short CPU trace when the cause is still unclear
Microsoft’s Windows Performance Recorder (WPR) captures activity that Windows Performance Analyzer (WPA) can inspect. The command-line recorder ships with Windows; the graphical recorder and analyzer are available through the Windows Performance Toolkit in the Windows ADK. Microsoft’s instructions in References provide the installation route. [1]
- Open Windows Performance Recorder with administrator permission. Expand More options.
- Use the General scenario and select CPU usage; the default First level triage profile can accompany it. Use Verbose detail for stack investigation.
- Start recording just before a short reproduction of the slowdown. Note when the symptom happens. A brief capture around the event is more useful than hours of unrelated activity.
- Select Save, describe the trigger, and save the ETL recording. Open it in WPA. Stop promptly, particularly in File mode, where recordings can grow quickly.
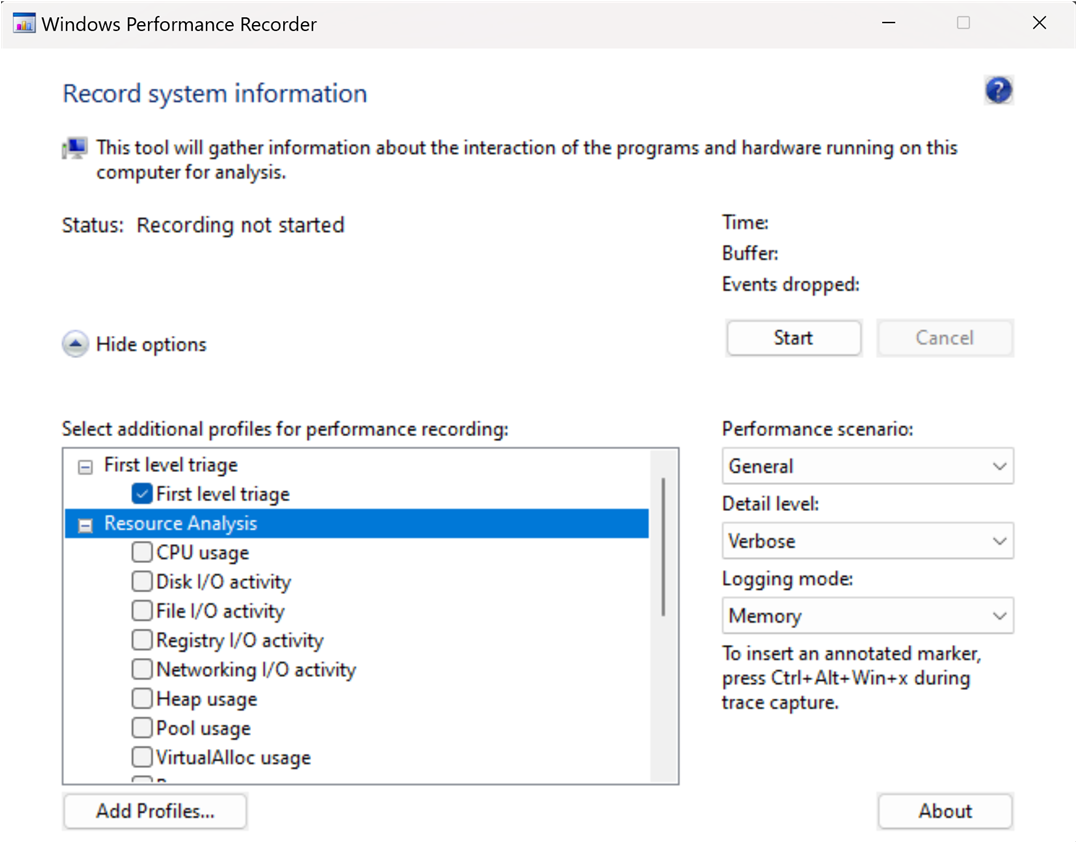
The source screenshot shows First level triage selected and CPU usage still unchecked. Select the CPU checkbox for this investigation. The picture identifies the controls; it is not a trace from a PC with an ntoskrnl.exe fault.
If another support session already owns a recording, coordinate with that technician before starting or cancelling one. Traces can include process names, paths and other system details. Keep them private and share them through a trusted support channel.
3. Read the busy interval and stack, not just the filename
In WPA, add Computation → CPU Usage (Sampled) to the analysis view. Select the interval where the slowdown actually occurred. Group the table by Process → Stack, or Process → Thread ID → Stack, and expand System (4). Load symbols through Trace → Load Symbols so available function names can be resolved. [1]
Inspect the branches with the largest contribution during that interval. CPU sampling estimates where processor time is being spent; a single sample or a filename appearing somewhere in a stack is weak evidence. Expand the busy branch and keep the surrounding frames, rather than copying only its first Windows module. Microsoft’s CPU analysis documentation describes this stack-based inspection. [2]
- A specific third-party driver repeatedly dominates the busy branch: identify the associated device or software package, then compare it with the trigger and driver history.
- Only shared Windows components are visible: the trace has narrowed the work, but may not identify its origin. Keep the stack and workload details for support; do not replace the named Windows file.
- Stacks are empty or addresses remain unresolved: check capture options and symbol loading. Vendor-private symbols may be unavailable. Missing detail is not evidence that no driver problem exists.
- Interrupt activity is the dominant problem: use the DPC/ISR view and the separate interrupt guide linked above. CPU samples alone can miss very short interrupt routines. [2]
Example: suppose System becomes busy during audio playback through a dock. A recording from that interval repeatedly includes a vendor audio-driver branch. Playback through another output is smooth, and reconnecting the dock brings the issue back. Together, those observations justify investigating the dock/audio path. They still leave several possibilities: the driver package, device, connection, or the workload using it. If the driver appears equally during smooth playback, its presence alone is much less informative.
This is an illustrative decision example, not a benchmark or a claim about a particular dock. The point is to connect three pieces of evidence: the symptom, the timed activity, and a repeatable comparison.
4. Change the identified component and verify the result
For a device implicated by the evidence, record its provider, version and date under Device Manager → device Properties → Driver. Obtain an appropriate update through Windows Update or the PC/device manufacturer’s official support page for your exact model. If the problem began after that driver’s update and Roll Back Driver is available, the previous version offers a useful comparison. Administrator permission is required. [3]
Change one package at a time, restart when required, and repeat the original workload with the same connections. Record whether the app responds properly and whether System’s CPU behavior improves. If necessary, take another short trace of the same action. A quieter idle graph is not enough if the game still stutters or the dock still fails after sleep.
If rollback is unavailable, do not fetch a loose .sys file or replacement ntoskrnl.exe from a download site. Ask the manufacturer for a compatible package. If a software component rather than a hardware driver is implicated, update or repair that application and retest. Avoid bulk driver updaters: changing many components at once obscures which change helped.
If the comparison fails, retain the result and return to the trace. Give support the PC model, Windows build, device and driver versions, exact trigger, failing time interval, and changes already tested. Do not enable Driver Verifier for all drivers as a routine home-PC fix; it is a specialized diagnostic tool that can deliberately provoke crashes.
When to check for malware or stop performance testing
The real Windows kernel is essential, and high CPU by itself is not a malware detection. Investigate compromise separately if the problem began after an unknown installer, security warnings recur, or unwanted changes appeared. A remaining service, scheduled task or bundled component can continue activity after the visible installer is removed.
In that situation, download and install Gridinsoft Anti-Malware, update its database, run a Full Scan, review detections, apply the appropriate cleanup and restart. Then repeat the original performance check. A scan can help find unwanted components; it does not repair a faulty driver or prove that every possible threat is absent.
If the process path is wrong, the name imitates a Windows component, or high CPU started after an unknown installer, scan for hidden miners, services, startup entries, and bundled components.
Run a malware checkIf the PC repeatedly crashes, freezes hard or loses storage access, preserve accessible important files and stop repeated workload tests. A crash report naming ntoskrnl.exe requires a separate investigation using the stop code, dump context and recent changes. The kernel’s name on the report alone does not establish that the kernel file is defective.
FAQ
Does a high ntoskrnl.exe reading mean I need a new CPU?
No. The reading describes work being performed, not the processor’s physical condition. Identify the workload and compare a targeted change before deciding that hardware needs replacement.
Why does the kernel appear even when I have closed every window?
Closing visible apps does not stop background services, device work or all activity an app started. Record the busy period and inspect its stack; the desktop looking idle does not mean Windows has no work to do.
Should I reinstall Windows if the trace still shows ntoskrnl.exe?
Its presence is expected in kernel work and is not, by itself, a reason to reinstall. First check whether you captured the failing interval with usable stacks and whether a specific device, driver or application explains it. Preserve your findings for support if the origin remains unclear.
References
- Microsoft. “Troubleshoot processes and threads by using WPR and WPA.” Microsoft Learn, updated February 12, 2026; accessed October 13, 2026. Recording and analyzing Windows activity.
- Microsoft. “CPU Analysis.” Microsoft Learn, accessed October 13, 2026. CPU sampling, stacks and interrupt analysis.
- Microsoft. “Update drivers through Device Manager in Windows.” Microsoft Support, accessed October 13, 2026. Driver update and rollback controls.