

Diagnostic Policy Service high CPU usage is a reason to investigate what Windows is repeatedly diagnosing. First confirm that the busy process actually hosts DPS, then match the spike to an event, device change, or network problem. Restarting may provide temporary relief, but deleting SRUDB.dat or disabling the service can leave the original problem unresolved. High CPU by itself does not mean the service is malware.
The useful distinction is whether diagnostics briefly runs and settles, or keeps doing the same work while the PC is otherwise idle. The steps below help you separate a recurring device or connection problem from damaged Windows components, SRU database errors, and a suspicious process using a familiar name.
1. Confirm the service behind the CPU spike
Diagnostic Policy Service is a Windows component for detecting and troubleshooting problems. Its short service name is DPS. Microsoft documents that stopping it prevents diagnostics from functioning.[1] It normally appears under a Service Host entry rather than as a program called DPS.exe.
- Press Ctrl+Shift+Esc, open Processes, and sort by CPU. Expand the busy Service Host entry and read the service name.
- Open Terminal as administrator and run
sc.exe queryex DPS. Record the STATE and PID shown in the result. - Find that PID on Task Manager’s Details page and compare its CPU use with the entry you first noticed. You can also run
tasklist /svc /fi "SERVICES eq DPS"to list the host. - Record when the load starts: immediately after sign-in, waking from sleep, connecting a dock or VPN, losing Wi-Fi, or opening a troubleshooter. Let any intentional troubleshooting finish before measuring again.
A PID identifies the current process, not a permanent service number. Recheck it after restarting. If several services share that host, its total CPU is not proof that DPS alone is responsible; keep the service list with your notes instead of killing the whole svchost.exe process.
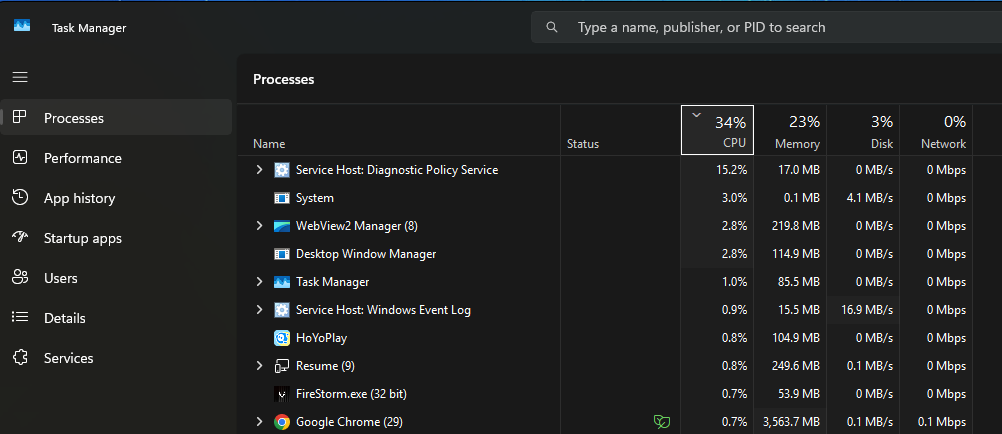
Task Manager’s total CPU percentage can hide a busy logical processor. A persistent 10–15% reading is worth investigating when it coincides with heat, fan noise, lag, or repeated events; there is no single percentage that proves corruption. Compare an idle period with the same activity that triggers the spike.
2. Find the event that repeats with the load
Open Event Viewer by running eventvwr.msc. Look in Windows Logs → System and Application around the time you recorded. Note the provider, event ID, full error text, and how often it repeats. Save relevant events before making changes. A warning from last month is a weaker lead than the same message appearing repeatedly during today’s CPU spike.
A Microsoft Q&A case illustrates why this matters: the poster reported that DPS load returned after deleting SRUDB.dat and even after a fresh Windows installation. Their later follow-up identified recurring corrected PCI Express hardware errors. The discussion did not establish a final successful repair, but it supplied a much more specific lead than another database deletion.[2]
- Repeated WHEA or device errors in System: Record the named device or PCI hardware identifier. Check the PC or motherboard maker’s support guidance for that exact model. A corrected error is not, on its own, a verdict that the device must be replaced.
- Wi-Fi reconnects, VPN changes, or a dock being attached: Test the connection or device involved, one change at a time. Compare the event timestamps and CPU before and after the test.
- Application events explicitly naming SRUJet or
SRUDB.dat: Save the complete error, including its code and path. Distinguish database errors from a file that is merely large; follow the SRU section below. - No matching event, but the same PID stays busy: Record a short reproducible example and move to a CPU trace or support review. Repeated resets will make the original state harder to compare.
For crashes or freezes at the same time, run perfmon /rel to open Reliability Monitor and inspect the corresponding day. Our Windows freezing guide covers the broader storage, memory, temperature, and driver branches.
3. Test the device or connection you can actually link to it
Save your work and restart once if the PC is too slow to investigate. Then reproduce the original trigger and change only one relevant variable. For example, if the load starts when you attach a USB network adapter, compare one session with that adapter disconnected and another with it attached. If the difference repeats, you have a useful lead for the adapter’s driver or hardware support team.
- After a driver change: check the exact device in Device Manager. A rollback is useful when the timing and version match the start of the problem; otherwise get the appropriate driver from the PC or component manufacturer.
- Only with a VPN or virtual adapter: use the application’s normal disconnect option for a brief comparison, if your work does not require that connection. On a managed PC, ask IT to investigate rather than changing its network configuration.
- Only with a peripheral or dock: safely disconnect the nonessential device, retest, and retain the before/after timestamps. Do not unplug storage while it is writing.
These comparisons narrow the cause; they are not a claim that two network adapters are inherently a problem. Avoid a network reset as the first experiment: it changes several variables and can require reconnecting or reconfiguring software. If the main symptom is heavy downloads rather than CPU, use the separate Network Service bandwidth guide.
4. Repair Windows files when there is evidence of corruption
If Windows components also fail, or the problem survives the targeted checks, install applicable Windows updates and restart. Microsoft recommends running DISM before System File Checker. In an administrator terminal, run the first command and wait for successful completion before running the second:[3]
DISM.exe /Online /Cleanup-Image /RestoreHealth
sfc /scannow
Keep the completion messages. If SFC repairs files, restart and repeat the original trigger. If either tool fails, retain the error code for the next repair step instead of assuming that running the command repaired Windows. A clean result shifts attention back to the recurring device, application, or service workload; it does not explain that workload by itself.
Should you delete SRUDB.dat?
Do not use SRU deletion as a routine first fix. The file commonly discussed in these guides is C:\Windows\System32\sru\SRUDB.dat. Its presence or size alone does not establish why DPS is busy. The Q&A example above is also a practical warning that deleting it need not stop recurrence.
Consider an SRU recovery only when saved events actually identify this database and ordinary Windows repair has not resolved the error. Make it a support-assisted, reversible operation: back up important data, preserve the original SRU database and associated files using a method that does not copy them halfway through a write, and agree on the rollback steps before replacing anything. Keep the error code and the original files available until the repaired system has been checked.
Do not delete the entire sru directory, fabricate an empty database, take ownership of system folders, or force-terminate a shared service host to make a file unlock. If the file is in use or DPS will not stop normally, that is a reason to pause and choose a supported recovery procedure for the machine. Clearing Application, System, or Security logs simply to remove the warnings also discards the evidence you need.
When does this become a malware check?
A familiar Service Host label is not enough to verify a process. Check the exact host executable’s location and Microsoft signature. A copy running from a user-writable folder, an invalid signature, or a spike that began after an unknown installer deserves the real-versus-fake svchost.exe checks.
If that suspicious-download scenario fits, a loader or bundled component may remain after the visible app is removed. You can download Gridinsoft Anti-Malware, update it, run a Full Scan, review the detections, apply the appropriate cleanup, and restart. Recheck the original symptom afterward. A scan addresses possible malware and persistence; it does not repair a faulty device driver or prove that a DPS CPU spike was an infection.
Confirm the result before calling it fixed
After each change, compare the same workload: idle after sign-in, wake from sleep, or the connection/device action that previously triggered the spike. Confirm that CPU settles and that the matching errors do not keep accumulating. A quiet minute immediately after reboot is insufficient when the original problem appeared only after several days.
If it returns, send support the Windows build, DPS PID and hosted-service list, trigger, event text, driver version, and what each individual change did. An administrator can capture a short Windows Performance Recorder trace while CPU is high. Microsoft’s general high-CPU guidance recommends a bounded three-to-five-minute capture because trace files grow quickly.[4] Share diagnostic files privately with the support team; they can contain system and application details.
FAQ
Can I permanently disable Diagnostic Policy Service?
It is a poor default fix for a normal Windows PC because diagnostics will stop functioning. Restore the service’s intended configuration after troubleshooting. If an organization deliberately manages it differently, leave that decision to its administrator.
Why does ending Diagnostic Policy Service only help temporarily?
Stopping the current work can lower CPU without changing what triggers it. Record what happens when the load returns—especially the same device event, connection change, or database error—so the next step addresses that condition.
Is Diagnostic Policy Service the same as State Repository Service?
No. They are different Windows services, even though both can appear under Service Host. Use the exact service name and PID to choose the troubleshooting path; a fix for one should not be applied to the other by name alone.
References
- Microsoft. Guidance on disabling system services on Windows IoT Enterprise. Microsoft Learn, accessed September 21, 2026. Diagnostic Policy Service entry.
- Josh Hleovas and contributors. Service Host: Diagnostic Policy Service has high CPU useage. Microsoft Q&A, July 27–August 15, 2025; accessed September 21, 2026.
- Microsoft. Using System File Checker in Windows. Microsoft Support, accessed September 21, 2026.
- Microsoft. Guidance for troubleshooting high CPU usage. Microsoft Learn, accessed September 21, 2026.